Kingdom of Thailand
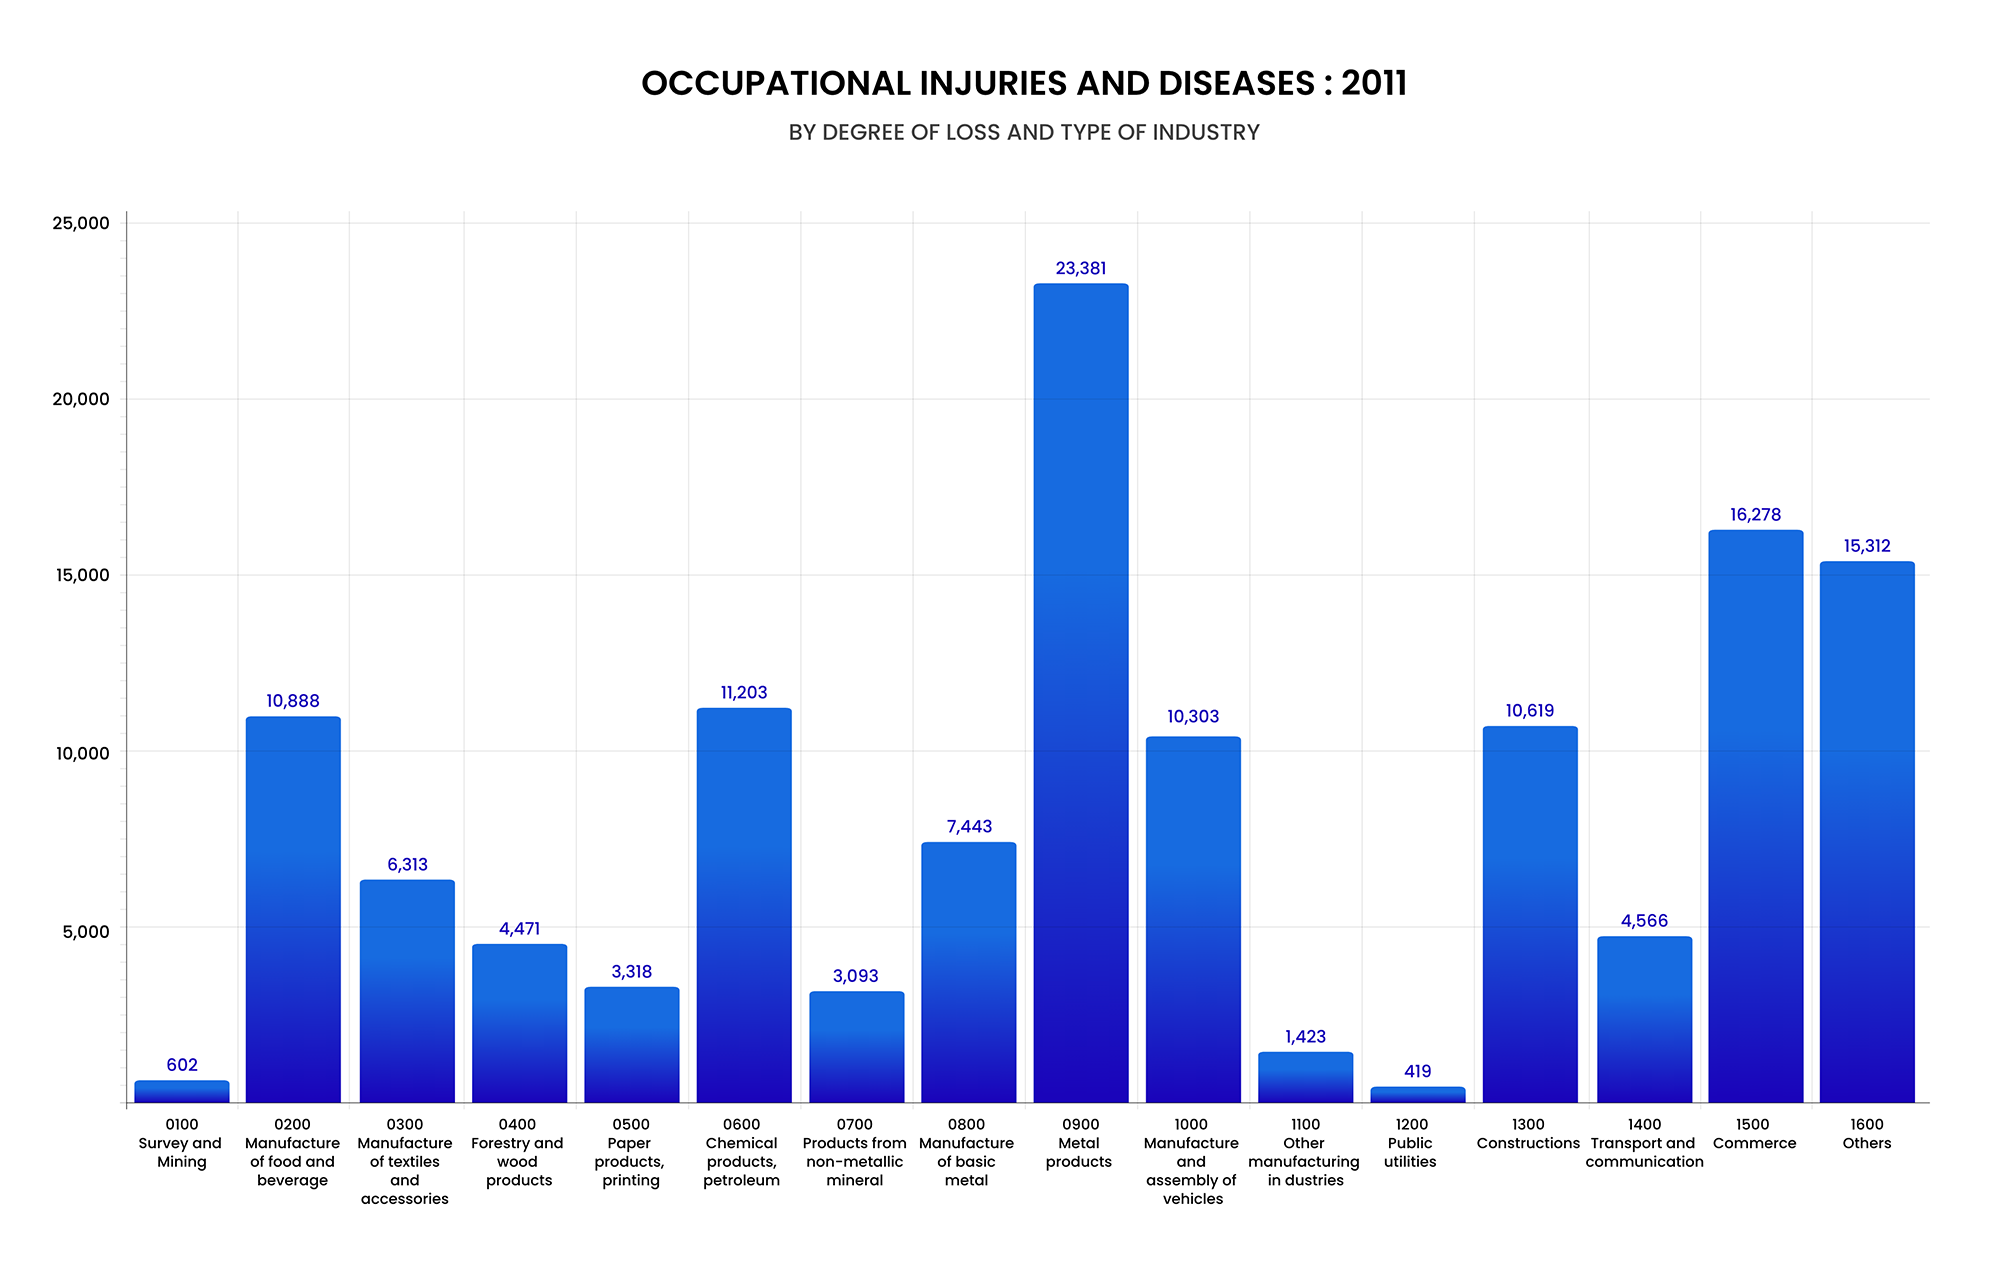
OCCUPATIONAL INJURIES AND DISEASES 2011
by Degree of Loss and Type of Industry
| Industrial Classification | Degree of loss | Total | ||||
|---|---|---|---|---|---|---|
| Death | Permanent Total Disability | Permanent Partial Disability | Temporary Disability >3Days | Temporary Disability <3Days | ||
| 0100 Survey and Mining | 10 | - | 9 | 211 | 372 | 602 |
| 0200 Manufacture of food and beverage | 77 | - | 134 | 3,269 | 7,408 | 10,888 |
| 0300 Manufacture of textiles and accessories | 10 | - | 114 | 1,884 | 4,305 | 6,313 |
| 0400 Forestry and wood products | 11 | - | 134 | 1,838 | 2,488 | 4,471 |
| 0500 Paper products, printing | 7 | - | 49 | 1,068 | 2,194 | 3,318 |
| 0600 Chemical products, petroleum | 25 | - | 205 | 3,101 | 7,872 | 11,203 |
| 0700 Products from non-metallic mineral | 16 | - | 51 | 1,010 | 2,016 | 3,093 |
| 0800 Manufacture of basic metal | 5 | - | 114 | 2,024 | 5,300 | 7,443 |
| 0900 Metal products | 23 | 1 | 406 | 5,822 | 17,129 | 23,381 |
| 1000 Manufacture and assembly of vehicles | 14 | - | 152 | 2,111 | 8,026 | 10,303 |
| 1100 Other manufacturing in dustries | 2 | - | 18 | 290 | 1,113 | 1,423 |
| 1200 Public utilities | 19 | 1 | 3 | 166 | 230 | 419 |
| 1300 Constructions | 87 | - | 53 | 2,614 | 7,865 | 10,619 |
| 1400 Transport and communication | 99 | - | 32 | 1,599 | 2,836 | 4,566 |
| 1500 Commerce | 98 | - | 99 | 4,814 | 11,267 | 16,278 |
| 1600 Others | 87 | 2 | 57 | 3,888 | 11,278 | 15,312 |
| Total | 590 | 4 | 1,630 | 35,709 | 91,699 | 129,632 |