Kingdom of Thailand
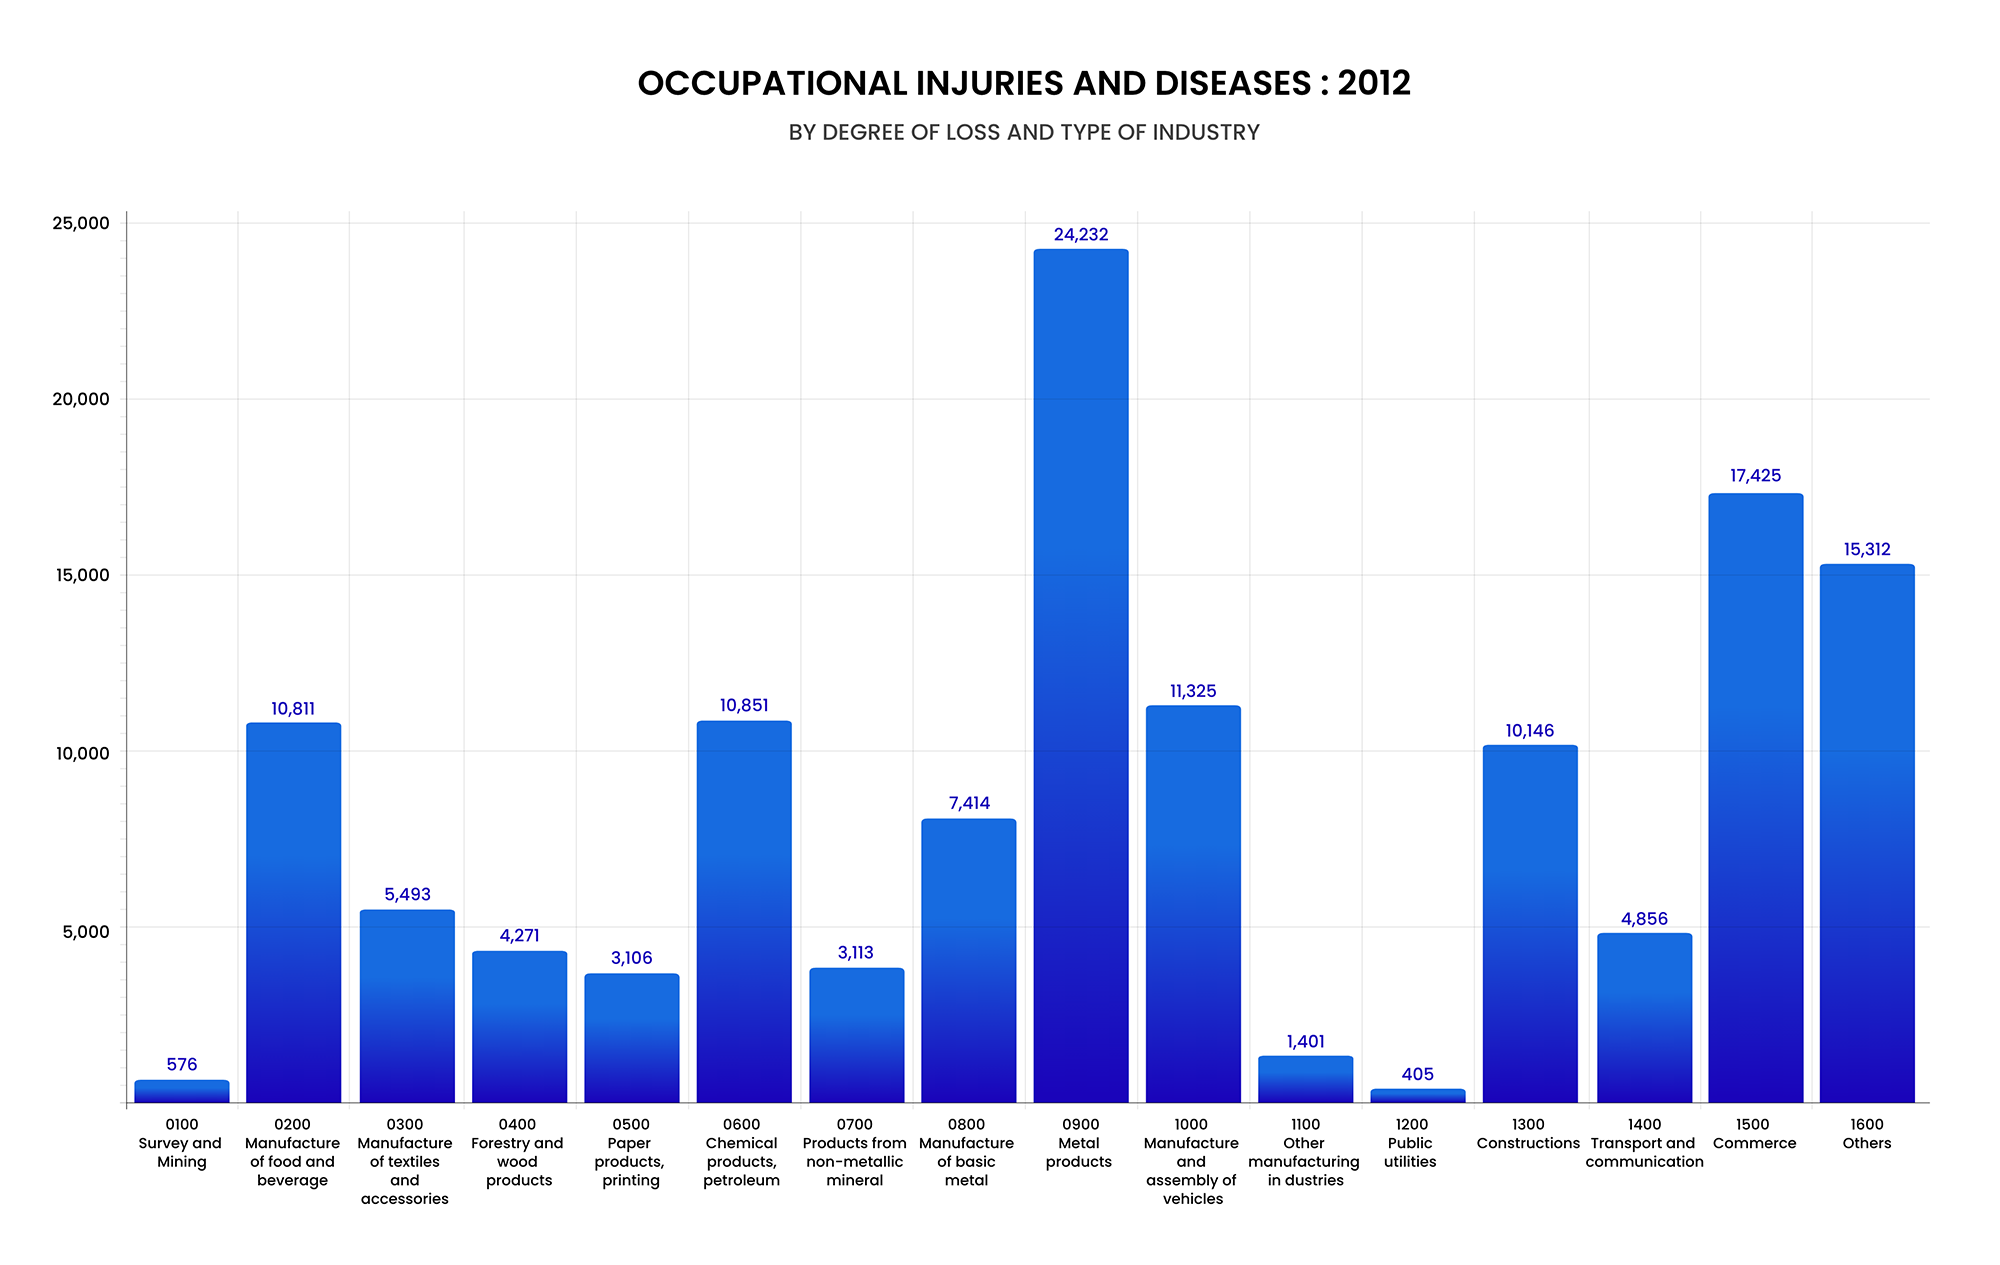
OCCUPATIONAL INJURIES AND DISEASES 2012
by Degree of Loss and Type of Industry
| Industrial Classification | Degree of loss | Total | ||||
|---|---|---|---|---|---|---|
| Death | Permanent Total Disability | Permanent Partial Disability | Temporary Disability >3Days | Temporary Disability <3Days | ||
| 0100 Survey and Mining | 10 | - | 9 | 212 | 345 | 576 |
| 0200 Manufacture of food and beverage | 57 | - | 143 | 3,303 | 7,308 | 10,811 |
| 0300 Manufacture of textiles and accessories | 10 | - | 102 | 1,654 | 3,727 | 5,493 |
| 0400 Forestry and wood products | 6 | - | 128 | 1,743 | 2,394 | 4,271 |
| 0500 Paper products, printing | 7 | - | 63 | 1,084 | 1,952 | 3,106 |
| 0600 Chemical products, petroleum | 29 | - | 243 | 2,972 | 7,607 | 10,851 |
| 0700 Products from non-metallic mineral | 19 | - | 47 | 1,007 | 2,040 | 3,113 |
| 0800 Manufacture of basic metal | 11 | 2 | 139 | 1,892 | 5,370 | 7,414 |
| 0900 Metal products | 55 | - | 403 | 5,957 | 17,817 | 24,232 |
| 1000 Manufacture and assembly of vehicles | 21 | - | 174 | 2,336 | 8,794 | 11,325 |
| 1100 Other manufacturing in dustries | 3 | - | 16 | 313 | 1,069 | 1,401 |
| 1200 Public utilities | 24 | - | 2 | 167 | 212 | 405 |
| 1300 Constructions | 88 | 3 | 79 | 2,435 | 7,541 | 10,146 |
| 1400 Transport and communication | 128 | 4 | 42 | 1,732 | 2,953 | 4,859 |
| 1500 Commerce | 130 | 7 | 162 | 5,096 | 12,030 | 17,425 |
| 1600 Others | 119 | 3 | 66 | 4,263 | 11,947 | 16,398 |
| Total | 717 | 19 | 1,818 | 36,166 | 93,106 | 131,826 |