Kingdom of Thailand
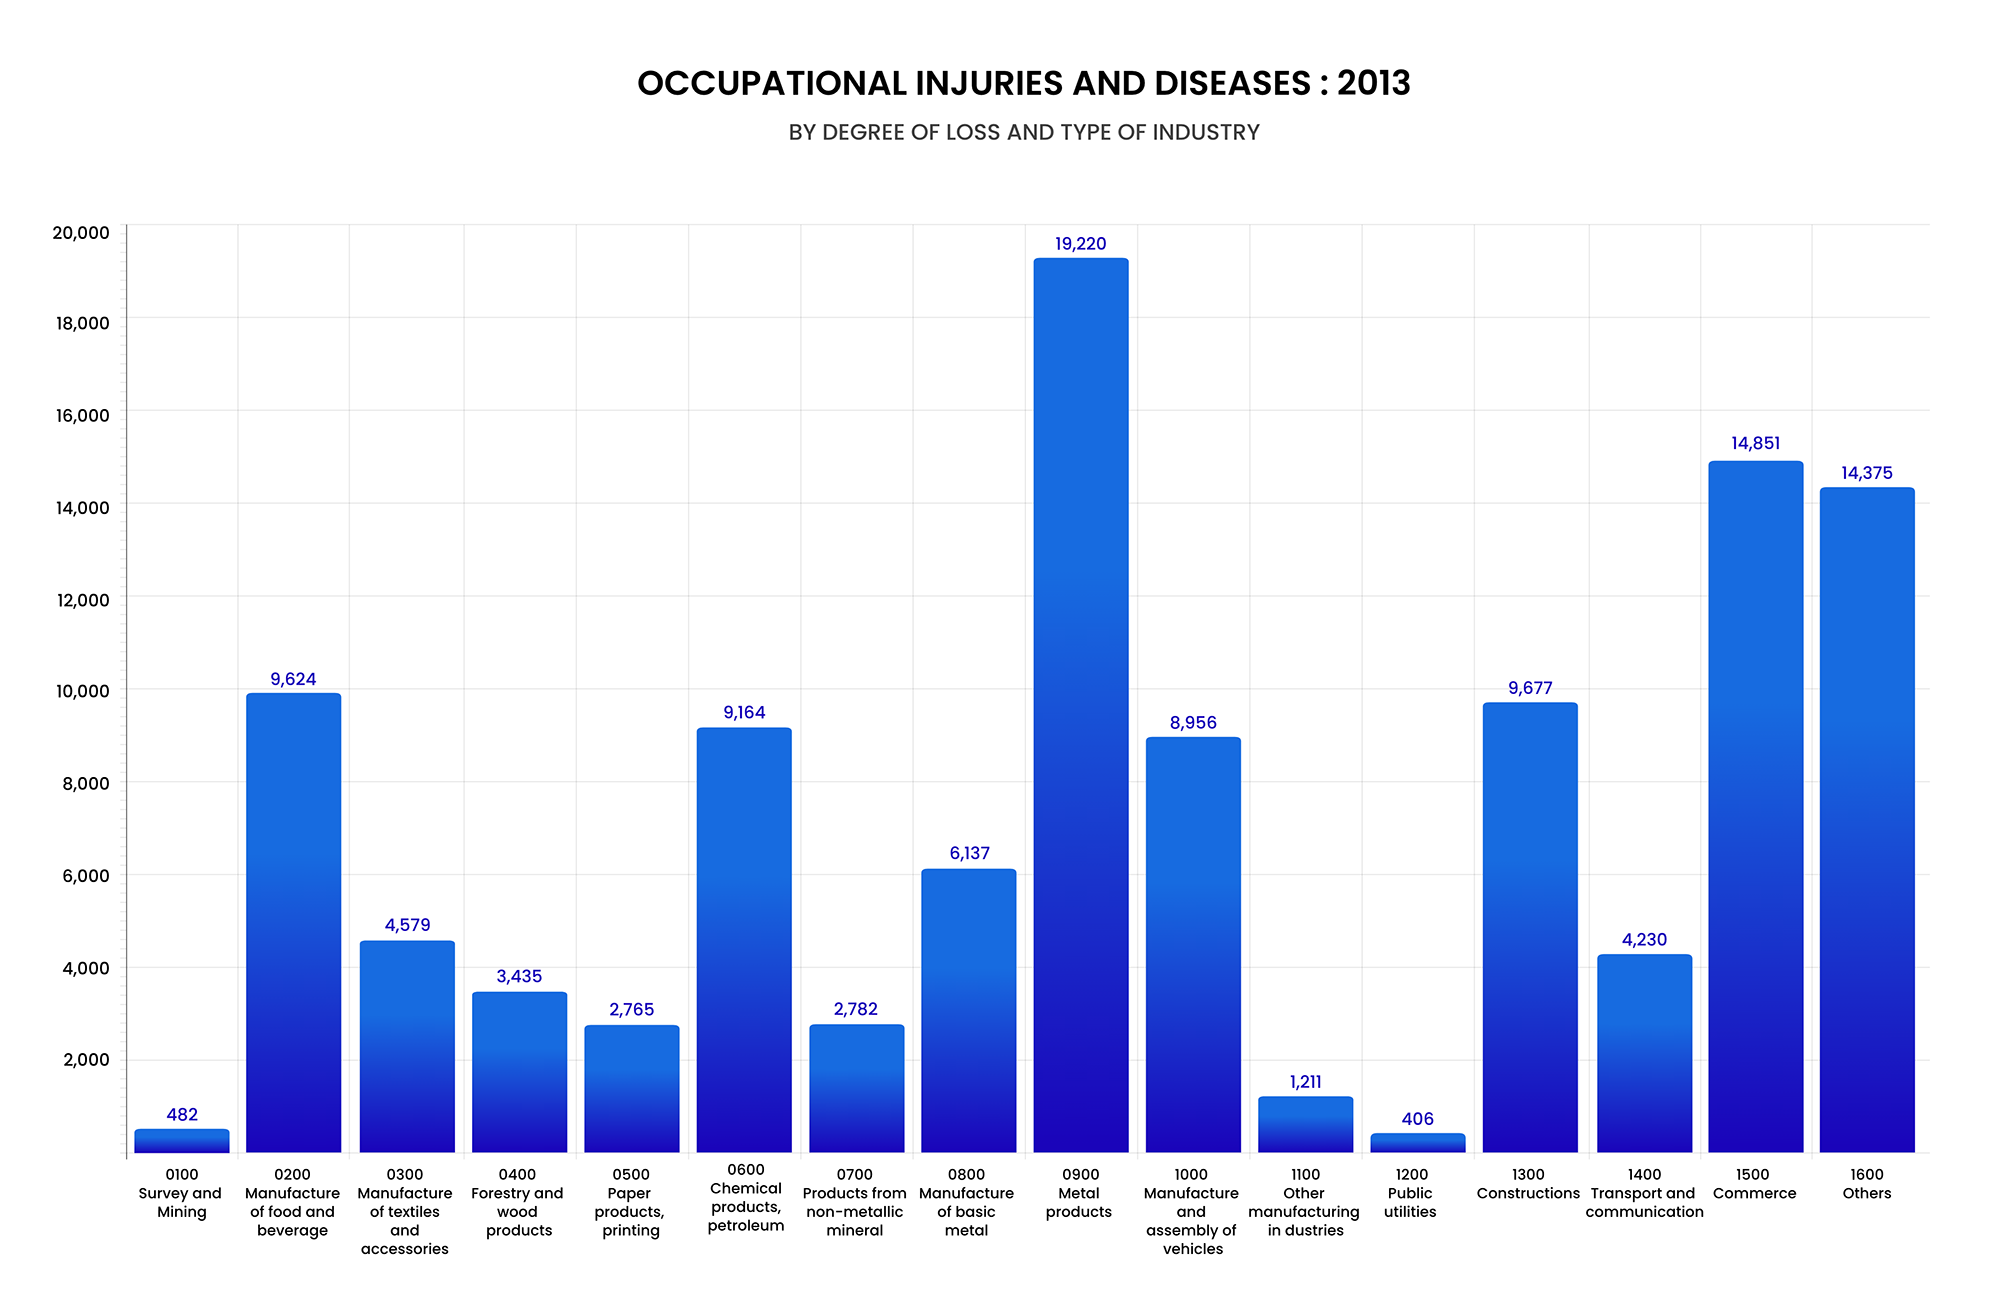
OCCUPATIONAL INJURIES AND DISEASES 2013
by Degree of Loss and Type of Industry
| Industrial Classification | Degree of loss | Total | ||||
|---|---|---|---|---|---|---|
| Death | Permanent Total Disability | Permanent Partial Disability | Temporary Disability >3Days | Temporary Disability <3Days | ||
| 0100 Survey and Mining | 13 | - | 14 | 197 | 258 | 482 |
| 0200 Manufacture of food and beverage | 45 | 1 | 232 | 2,882 | 6,464 | 9,624 |
| 0300 Manufacture of textiles and accessories | 5 | - | 162 | 1,334 | 3,078 | 4,579 |
| 0400 Forestry and wood products | 14 | 1 | 207 | 1,417 | 1,796 | 3,435 |
| 0500 Paper products, printing | 8 | - | 121 | 929 | 1,707 | 2,765 |
| 0600 Chemical products, petroleum | 27 | 1 | 351 | 2,660 | 6,125 | 9,164 |
| 0700 Products from non-metallic mineral | 27 | 1 | 114 | 883 | 1,757 | 2,782 |
| 0800 Manufacture of basic metal | 9 | 2 | 258 | 1,542 | 4,326 | 6,137 |
| 0900 Metal products | 42 | 4 | 723 | 4,708 | 13,743 | 19,220 |
| 1000 Manufacture and assembly of vehicles | 15 | - | 288 | 1,847 | 6,806 | 8,956 |
| 1100 Other manufacturing in dustries | 1 | - | 30 | 304 | 876 | 1,211 |
| 1200 Public utilities | 19 | 3 | 6 | 173 | 205 | 406 |
| 1300 Constructions | 74 | 7 | 120 | 2,423 | 7,053 | 9,677 |
| 1400 Transport and communication | 137 | 1 | 83 | 1,607 | 2,402 | 4,230 |
| 1500 Commerce | 102 | 3 | 215 | 4,526 | 10,005 | 14,851 |
| 1600 Others | 97 | 4 | 112 | 3,987 | 10,175 | 14,375 |
| Total | 635 | 28 | 3,036 | 31,419 | 76,776 | 111,894 |